


Why Teams Shouldn't Sign Relievers to Large, Long-Term Deals
Are relievers the most replaceable position in baseball?

Having a dependable relief pitcher come out of the bullpen in a high leverage spot is, to say the least, quite relieving.
In a one-run game, you want a guy you’re confident in to be the difference maker between a win and a loss. A good bullpen is a strong positional advantage over your opponent. It allows you to be more expressive and take more risks with your pitching staff.
What gets lost in translation for this “need” is the desperation some teams express when overpaying for a position not worthy of it.
Relievers shouldn’t be any team’s top priority when it comes to free agency. At least in my opinion. They are expendable and often overvalued in the eyes of executives. Their career length of productivity is short and the gap between AAA and MLB level arms has been decreasing over the last few years. There are plenty of undiscovered arms in the lower levels of baseball that have the ability to succeed in the big leagues. Willing to take risks in younger, cheaper arms has paid off for many small-market clubs.
On top of that, relievers also aren’t very predictable. Their production on a year-to-year basis is quite volatile making it hard to be confident in a reliever's success given their ability from the year before.
My argument isn’t that relievers are not important. They face the most high-leverage situations in all of baseball. My argument is that the idea to invest a significant portion of your payroll in the position is not the best use of salary allocation.
Let me take you through a few reasons.
At a certain amount of innings pitched, we often see a dropoff in production
By plotting season xFIP against career innings pitched for relievers, we can see that at around 330 career IP, there is a noticeable dropoff in pitching success. The trend between 75 and 275 IP displays how younger relievers succeed more with experience. Yet at around 330 career IP, the shift changes to a higher xFIP. It almost looks like at that number of innings pitched, a reliever’s productivity begins to stall and no longer see the year-to-year improvement we see early in their career.
Now, this isn’t the case for every relief pitcher, but it is a noticeable trend that is quite useful when identifying a possible signal of decreased production.

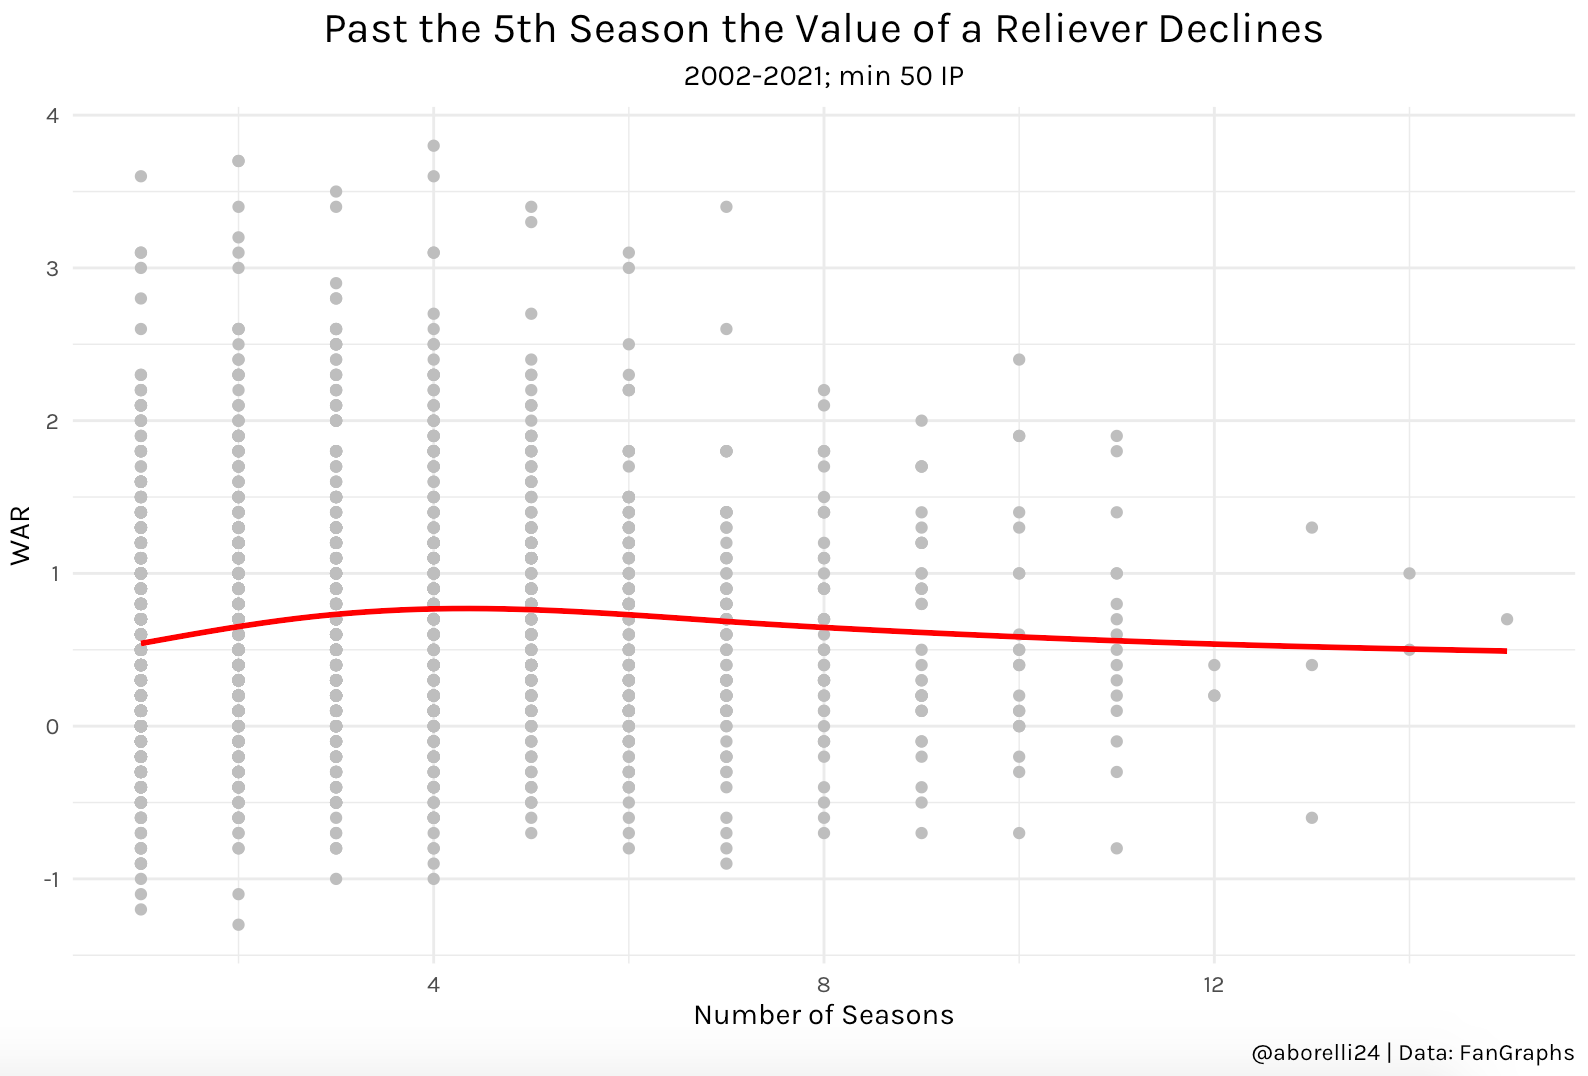
From a WAR perspective, we see a similar change at around 330 IP as well. That 330 IP mark is around the 5th to 7th-year mark of a reliever’s career. As many of you know, a player does not reach free agency until the 6th year of their career.

A reliever’s timeline of production follows the same path of their club rights. As we can see from the plot below, following the fifth MLB season relievers on average see a decrease in production. The range in WAR amongst relievers is highest in the first couple of years however as the number of seasons progress, the predictiveness of a reliever’s ability becomes a lot easier.
Investing more in your bullpen doesn’t always equal more success
If we look at how much each club has invested in their bullpen this season, and the success of their efforts, we can draw some interesting analysis. First off, the team with the best, most impressive bullpen, ranks 19th in total reliever salary and 27th in average salary. The Tampa Bay Rays are proving that you don’t need to spend a lot on big arms to accumulate regular-season wins. Now, that’s not to say pricey relievers are not important at all, there is a chance spending more on relievers brings better postseason success but the sample size in those situations is too little to examine for now.

Take a look at reliever salary allocation in the form of a scatterplot. Investing past 2 million in average reliever salary doesn't seem to relatively help create any more wins from the position. The Mets have invested heavily in the position but due poor performances this year from some of their higher paid guys like Jeurys Familia, they’re not seeing their investment pay off.

Relievers are a lot more volatile from year to year than starters
Paying players is often based on what players have done. Not what they will do. This is quite evident when evaluating relievers. Looking at success compared in year N vs year N+1, the year-to-year success is correlated quite significantly more in starters compared to relievers. What that tells me is relievers see dropoffs and unexpected surges more than you would expect.

If this really is the case, don’t relievers seem like the perfect case to buy low and sell high? That seems to explain why we see so many relief arms dealt at the deadline. They are replaceable and expendable for every franchise. You’ll see a controllable top reliever dealt more often than a starter or hitter. Look at former Seattle Mariner, Kendall Graveman. When Graveman, the Mariners closer for the first half of the year who posted an incredible 0.82 ERA, was dealt to the Astros, fans were confused as to why the Mariners would deal their closer in the middle of a playoff race.
Well, simply put the Mariners bought low and sold high. In the two years prior to his incredible 2021 performance, Graveman had an ERA of 7.6 and 5.7 in 2018 and 2020 respectively. More surprising than the trade was how Graveman was able to turn around a sub-par relief career into an all-star season. The Mariners knew relievers are unpredictable and as a result gained a strong bat in Abraham Toro when trading him to the Astros.
The gap between the highest and lowest paid relievers isn’t that big
The top-10 relievers this season are 3rd in average xFIP and ERA. Surprisingly, the bottom-10 in this table finished 4th and 6th respectively. The gap between the bottom and top in xFIP is just 0.15 while the average salary difference is around 14 million. By those numbers, teams this season are paying roughly a million dollars for every 0.01 gain in reliever xFIP on average.

The gain in production flattens out after about 10 million
Before we conclude, I wanted to take a look at the production in WAR for all relievers with a minimum of 20 IP this season. As we would expect, relief pitchers making the league minimum have a wide range in productivity. However, I think it is important to note the trend between 4.5 and 10 million. After 10 million, the trend line smooths out and doesn’t see the same positive trend in WAR. That range of roughly 5 million seems to be the sweet spot in gaining wins from your reliever.

Conclusion
Relievers have possibly the hardest job in all of baseball. They are often relied upon in the highest leverage moments of a game. Their success in those positions is often the difference maker between the big leagues and lower-level baseball. This article wasn’t written to ridicule position but to rather inform those on the replaceability of relievers. MLB organizations should be looking to stress their payroll on other positions rather than the one with possibly the earliest sign of decline.
The option of replacing any reliever is often there. We see relievers make their debut more than any other position. Of the 337 pitchers to make their rookie debut this season, 295 of them were relievers. That is roughly 87% of all pitchers. And on top of that, these rookies are pretty good as well.

The difference in ability between rookies and the rest of the league has been minimal with the first-year players just slightly behind league average. Think about that chart we looked at earlier. Relievers on average get better with more innings until about 330 IP. For rookies to be just ever so slightly behind the rest of the league in their first career innings is quite impressive and indicative of some front offices overvaluing experienced relievers.
For large market clubs, proper salary allocation isn’t the highest priority. Teams like the New York Yankees and Los Angeles Dodgers don’t need to necessarily worry about slightly overpaying a reliever. However, for these smaller market teams, paying a reliever ever so slightly over their true value can be the difference-maker between a successful and unsuccessful season.