

Analyzing NBA Shot Success Through Expected Points
Analyzing NBA Shot Success Through Expected Points
Following suit of soccer and football, expected points allows us to get a better understanding of player shooting success in the NBA


Introduction
All shots aren’t created equal. Shots differ in value, a half-court 3-point heave should not be looked at the same as a catch-and-shoot corner 3. A tip-in layup isn’t the same as a reverse driving layup. When we look at just a player’s shooting percentages, we are leaving a big part of the story. We aren’t taking into account the endless variables that result in X player’s performance. My job today is to explain to you how we can do a better job of doing so through expected points, before taking a look at which players exceed in this area of scoring more points than expected.
If you aren’t familiar already, expected goals have taken over the European football community. Expected goals are a measurement of how likely it is that a particular goalscoring chance will be taken. It takes into account endless variables: the distance from the goal of the striker, positioning of the goalkeeper, body part used to take the shot, angle from goal, etc. Using tons and tons of data, a number is calculated to determine the likelihood of a goal in a given opportunity. For example, a shot one foot from the goal with no defenders around would have an expected goal (xG) of 0.99 while a shot across the pitch from 40+ yards away would likely have an xG of 0.01.
Originally starting as a behind-the-scenes analysis tactic, expected goals are now a mainstream stat that can be found within the box scores of many matches. Brentford, a premier league club that made its way from the lower levels of England to the top flight, used xG to identify undervalued players, develop them, and sell them for an incredible profit. That profit was then reinvested back into the team and essentially helped them earn promotion to the Premier League.
Data analysts have implemented their own Expected Points statistic for the NFL. As described by The 33rd Team, “Expected Points is based off the notion that not all yards gained in football are of equal value. For example, a 5-yard gain on third-and-3 increases a team’s chances of scoring much more than the same 5-yard gain on third-and-10. While both situations would reflect a gain of five yards in a traditional box score, the first would result in a first down and continue the drive, while the other would likely force the team to punt on fourth down. Expected Points attempts to quantify this difference in value by relating each play to how much it increases (or decreases) a team’s chances of scoring.” Essentially, the sports world is experiencing a new wave of statistical analysis in way of expected points. But one league seems to be lacking in this area. The NBA.
Insert xP, expected points, a measure I created to get an understanding of shot make expectancy. By taking shot location data from the last 10 years and analyzing each of their characteristics, I was able to create a new statistic that can be used to understand which players exceed or fail at making more shots than expected.
Basic Analysis
When creating this model, we needed to first identify the variables we will be using to create this metric. Using play-by-play data over the last 10 seasons via the nbastatR package, we can get an understanding of what things we can and cannot model.
Shot Distance - Y-location, distance relative to the hoop. How far away a player is shooting from the basket will affect its probability.
Horizontal Court Location - X-location, distance horizontally relative to the hoop. Shots taken right under the basket have a higher make probability.
Shot Type - We can break down the different types of shots: layup, dunk, jump shot, etc.
We then break it down even further: reverse layups, stepback jumpers, put-back dunks, etc.
Total Seconds Remaining - How many seconds are left in the quarter, shots with 0 seconds remaining have a much lower expected make probability.
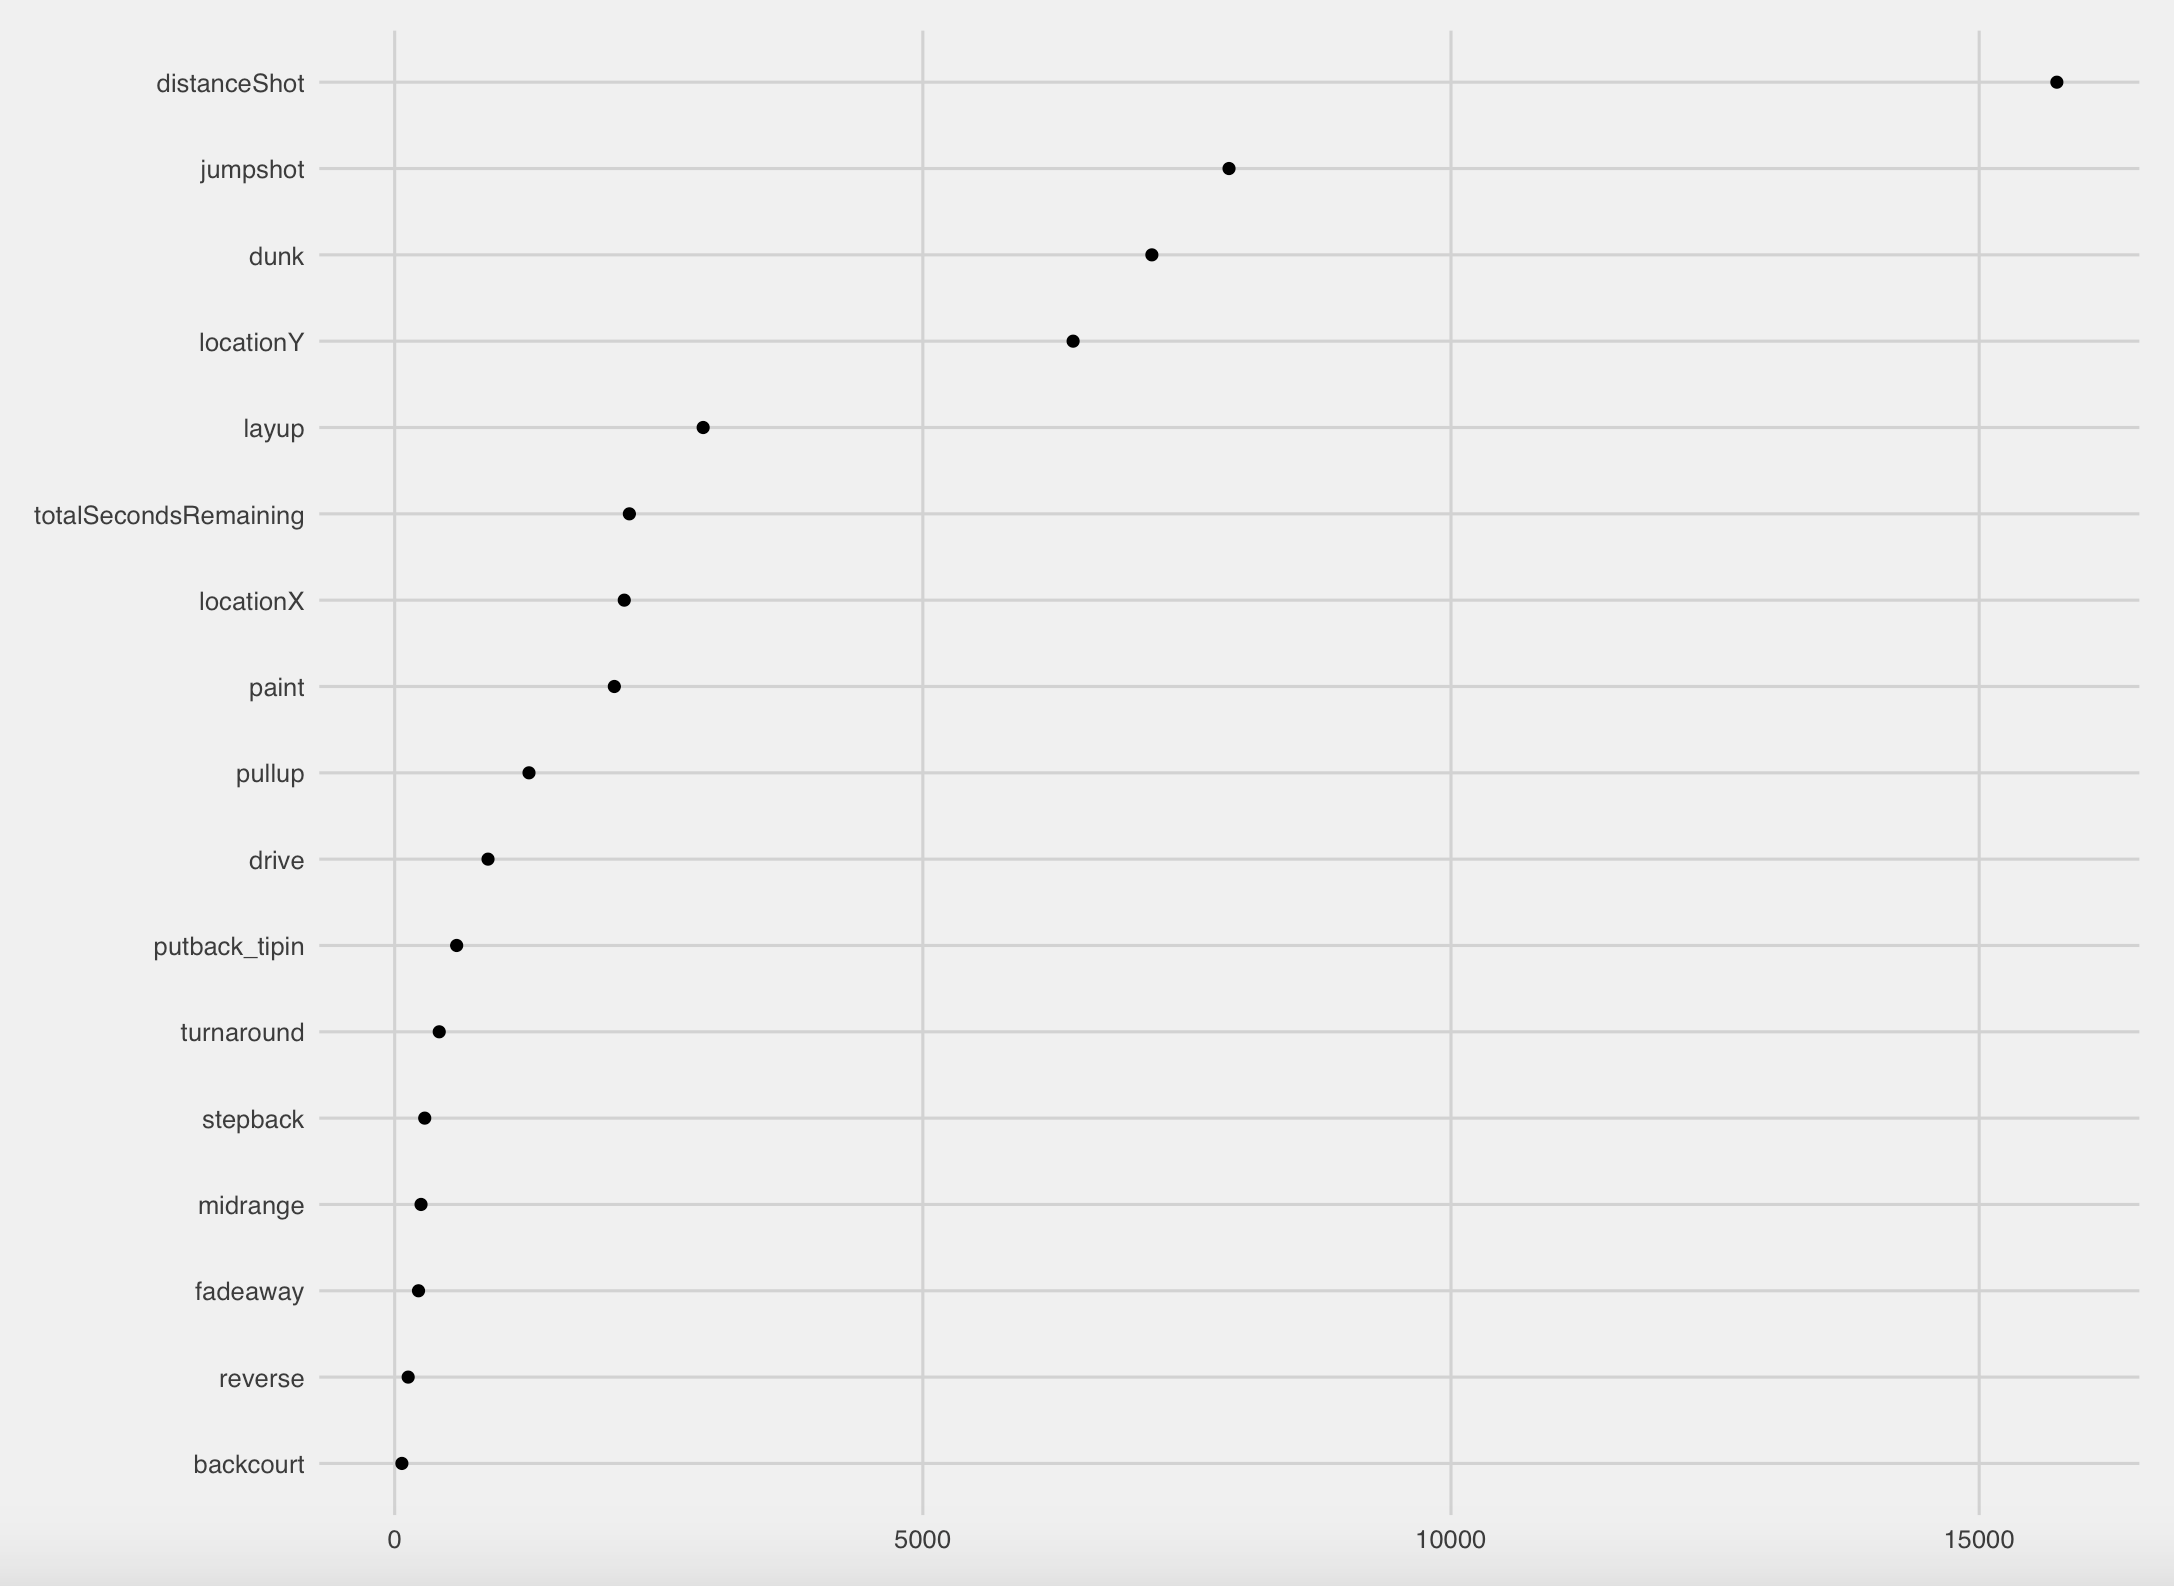
In the above graphic, we can see the variables included in our model and the importance of each - higher x value, greater importance.
Random Forest Model
By modeling shot probability, we’re able to get an ‘expected points’ metric by combining probability and shot type. For example, a two-point shot attempt with a shot probability of 50% would return an xP of 0.5. Compiling each shot attempt throughout the season allows us to see which players score the most points over expected and which score the least. From all of this, we create some new, interesting stats.
TPOE - Total Points Scored Over Expected
SPOE - Shooting Percentage Over Expected
XeFG - Expected Effective Field Goal Percentage
eFGOE - Effective Field Goal Percentage Over Expected
xPPS - Expected Points Per Shot Attempt
As you can see in the graphic below, xP shows a pretty similar story to what the Houston Rockets implemented under Daryl Morey. ‘Moreyball’ was its name and basically implemented a strategy to maximize points per possession through 3-pointers and layups, passing up on mid-range shots entirely.
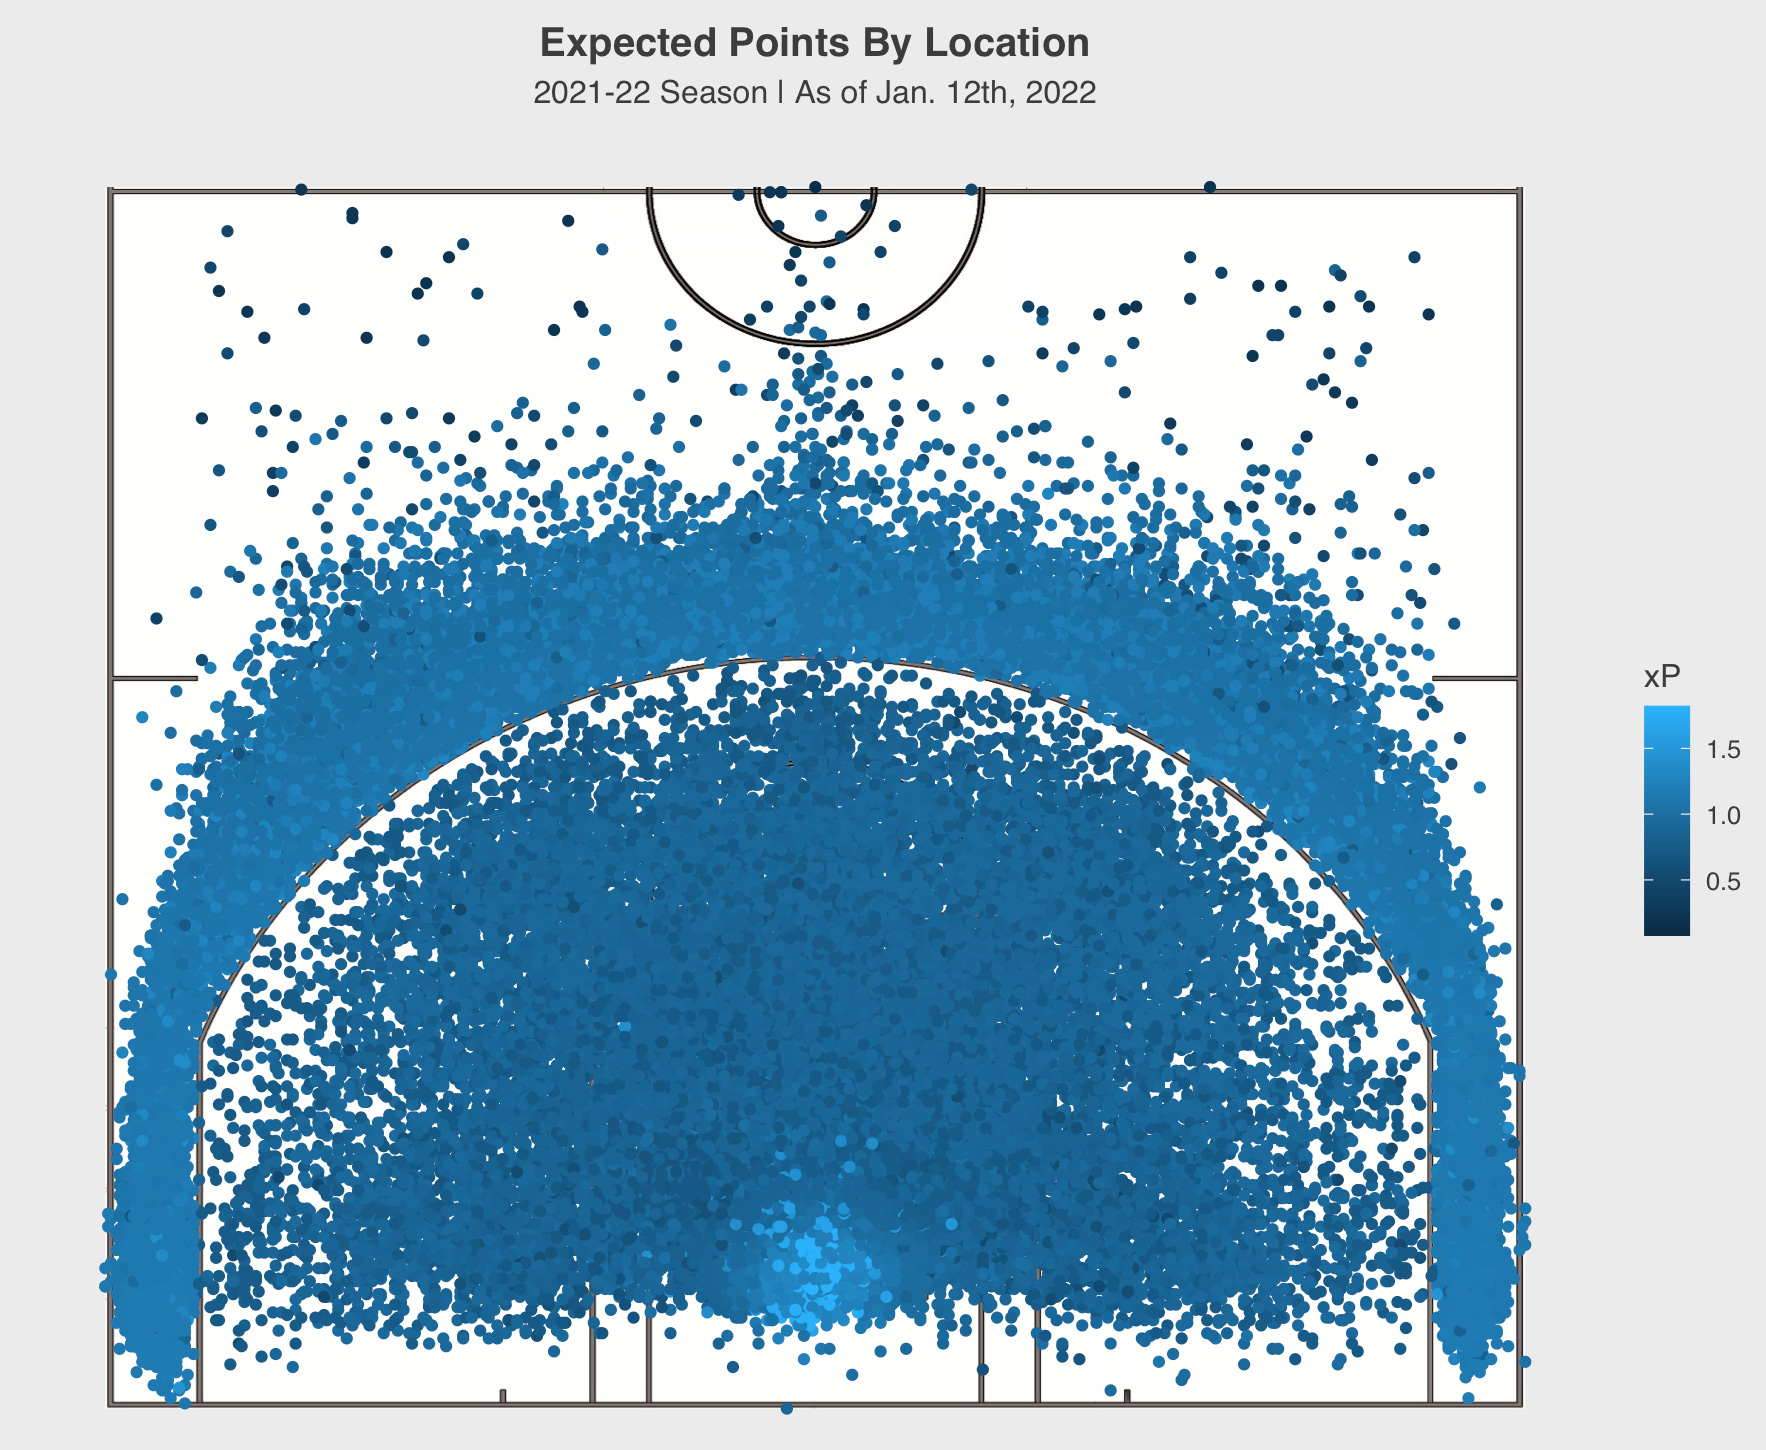
My model backs up this strategy. Mid-range shots, as many in the analytics community have been preaching for years, have a much lower xP metric than layups and three-point shots.
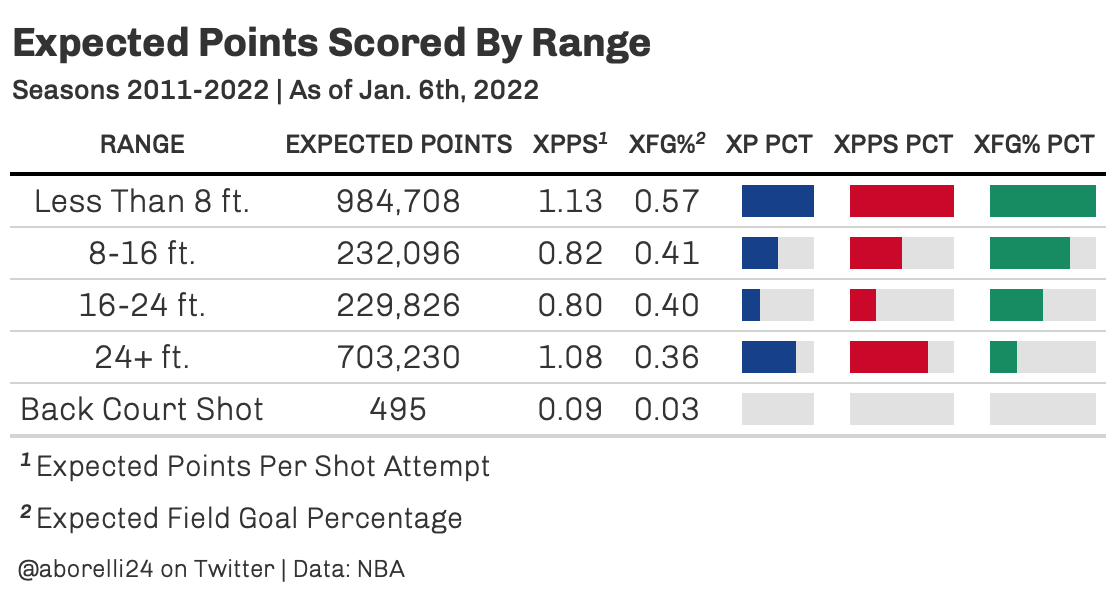
To further prove that point, I took a look at the average xP per shot distance. Shots near the rim (less than 8 ft.) and three-point shots (24+ ft.) have created the most xP over the last 10 years. Mid-range shots create the lowest expected points per shot other than back-court shots, displaying the poor value that is taken in a mid-range shot.
Results - Leaders
Below are the top-15 teams in points scored over expected. These teams are in the upper half of scoring more points than our expected metric. The Utah Jazz, who notably take and make more threes than any other NBA team, lead the way in TPOE.
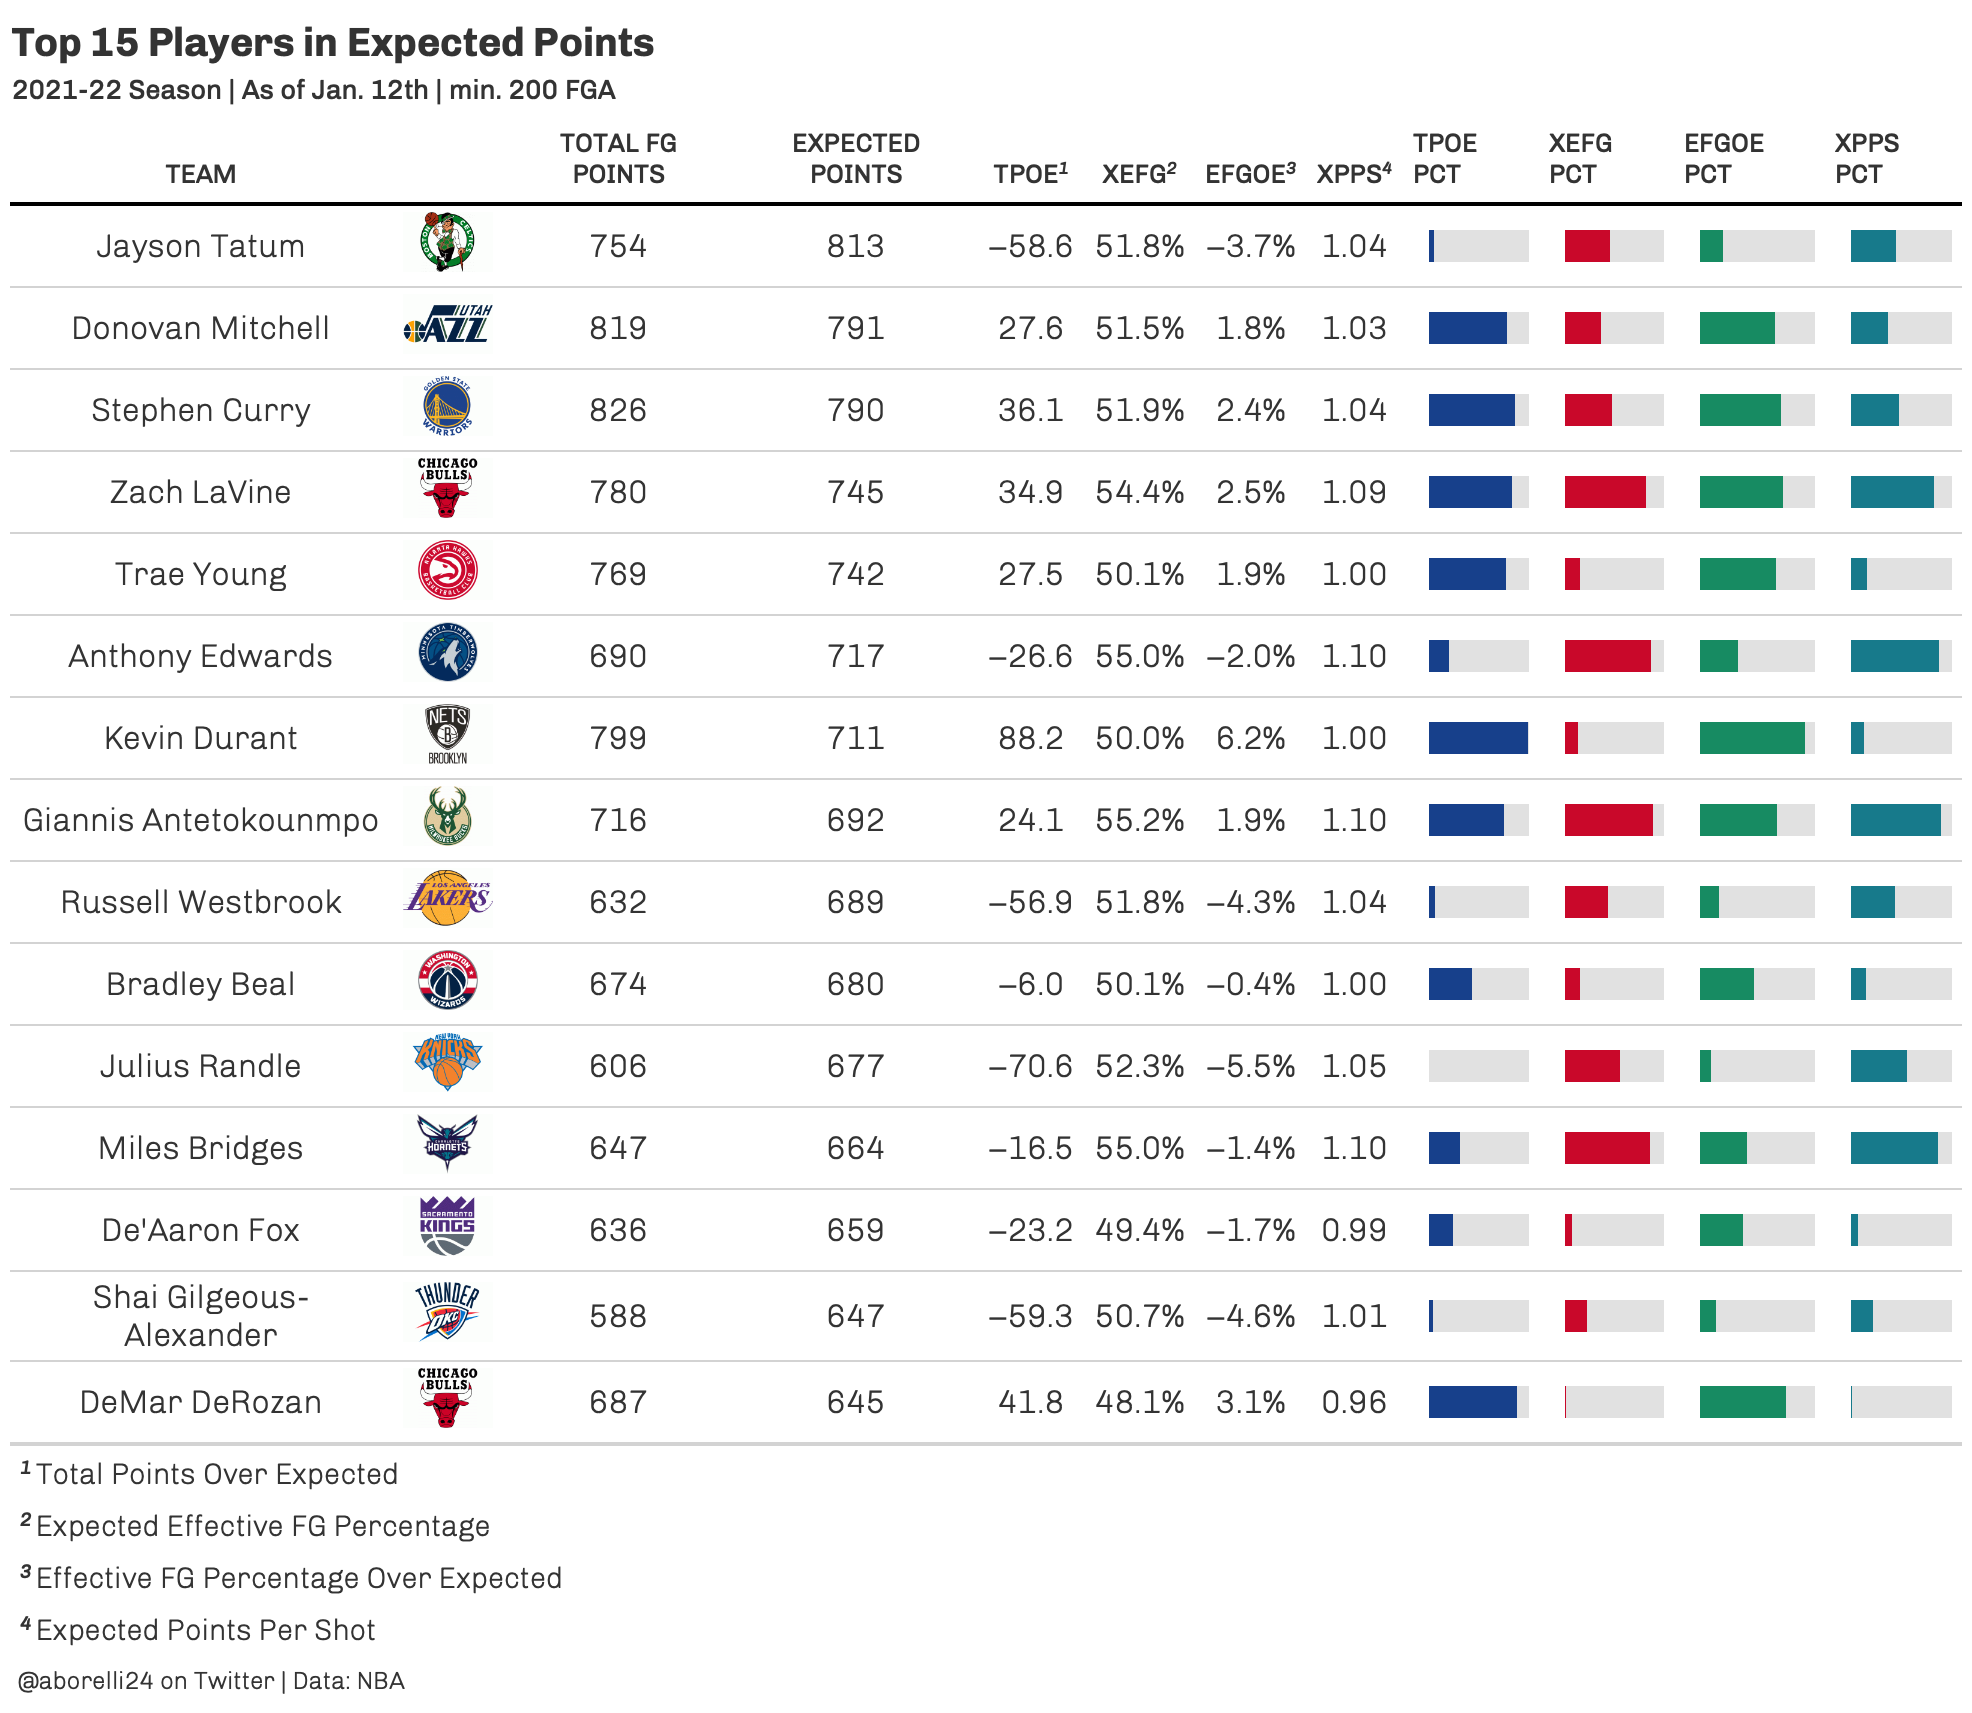
When we break it down on a player-by-player level, we can see the leaders in expected points and TPOE. First, when we look at our xP rankings, we see notable offensive scorers like Jayson Tatum and Steph Curry lead the pack of the many All-stars amongst the top-15.
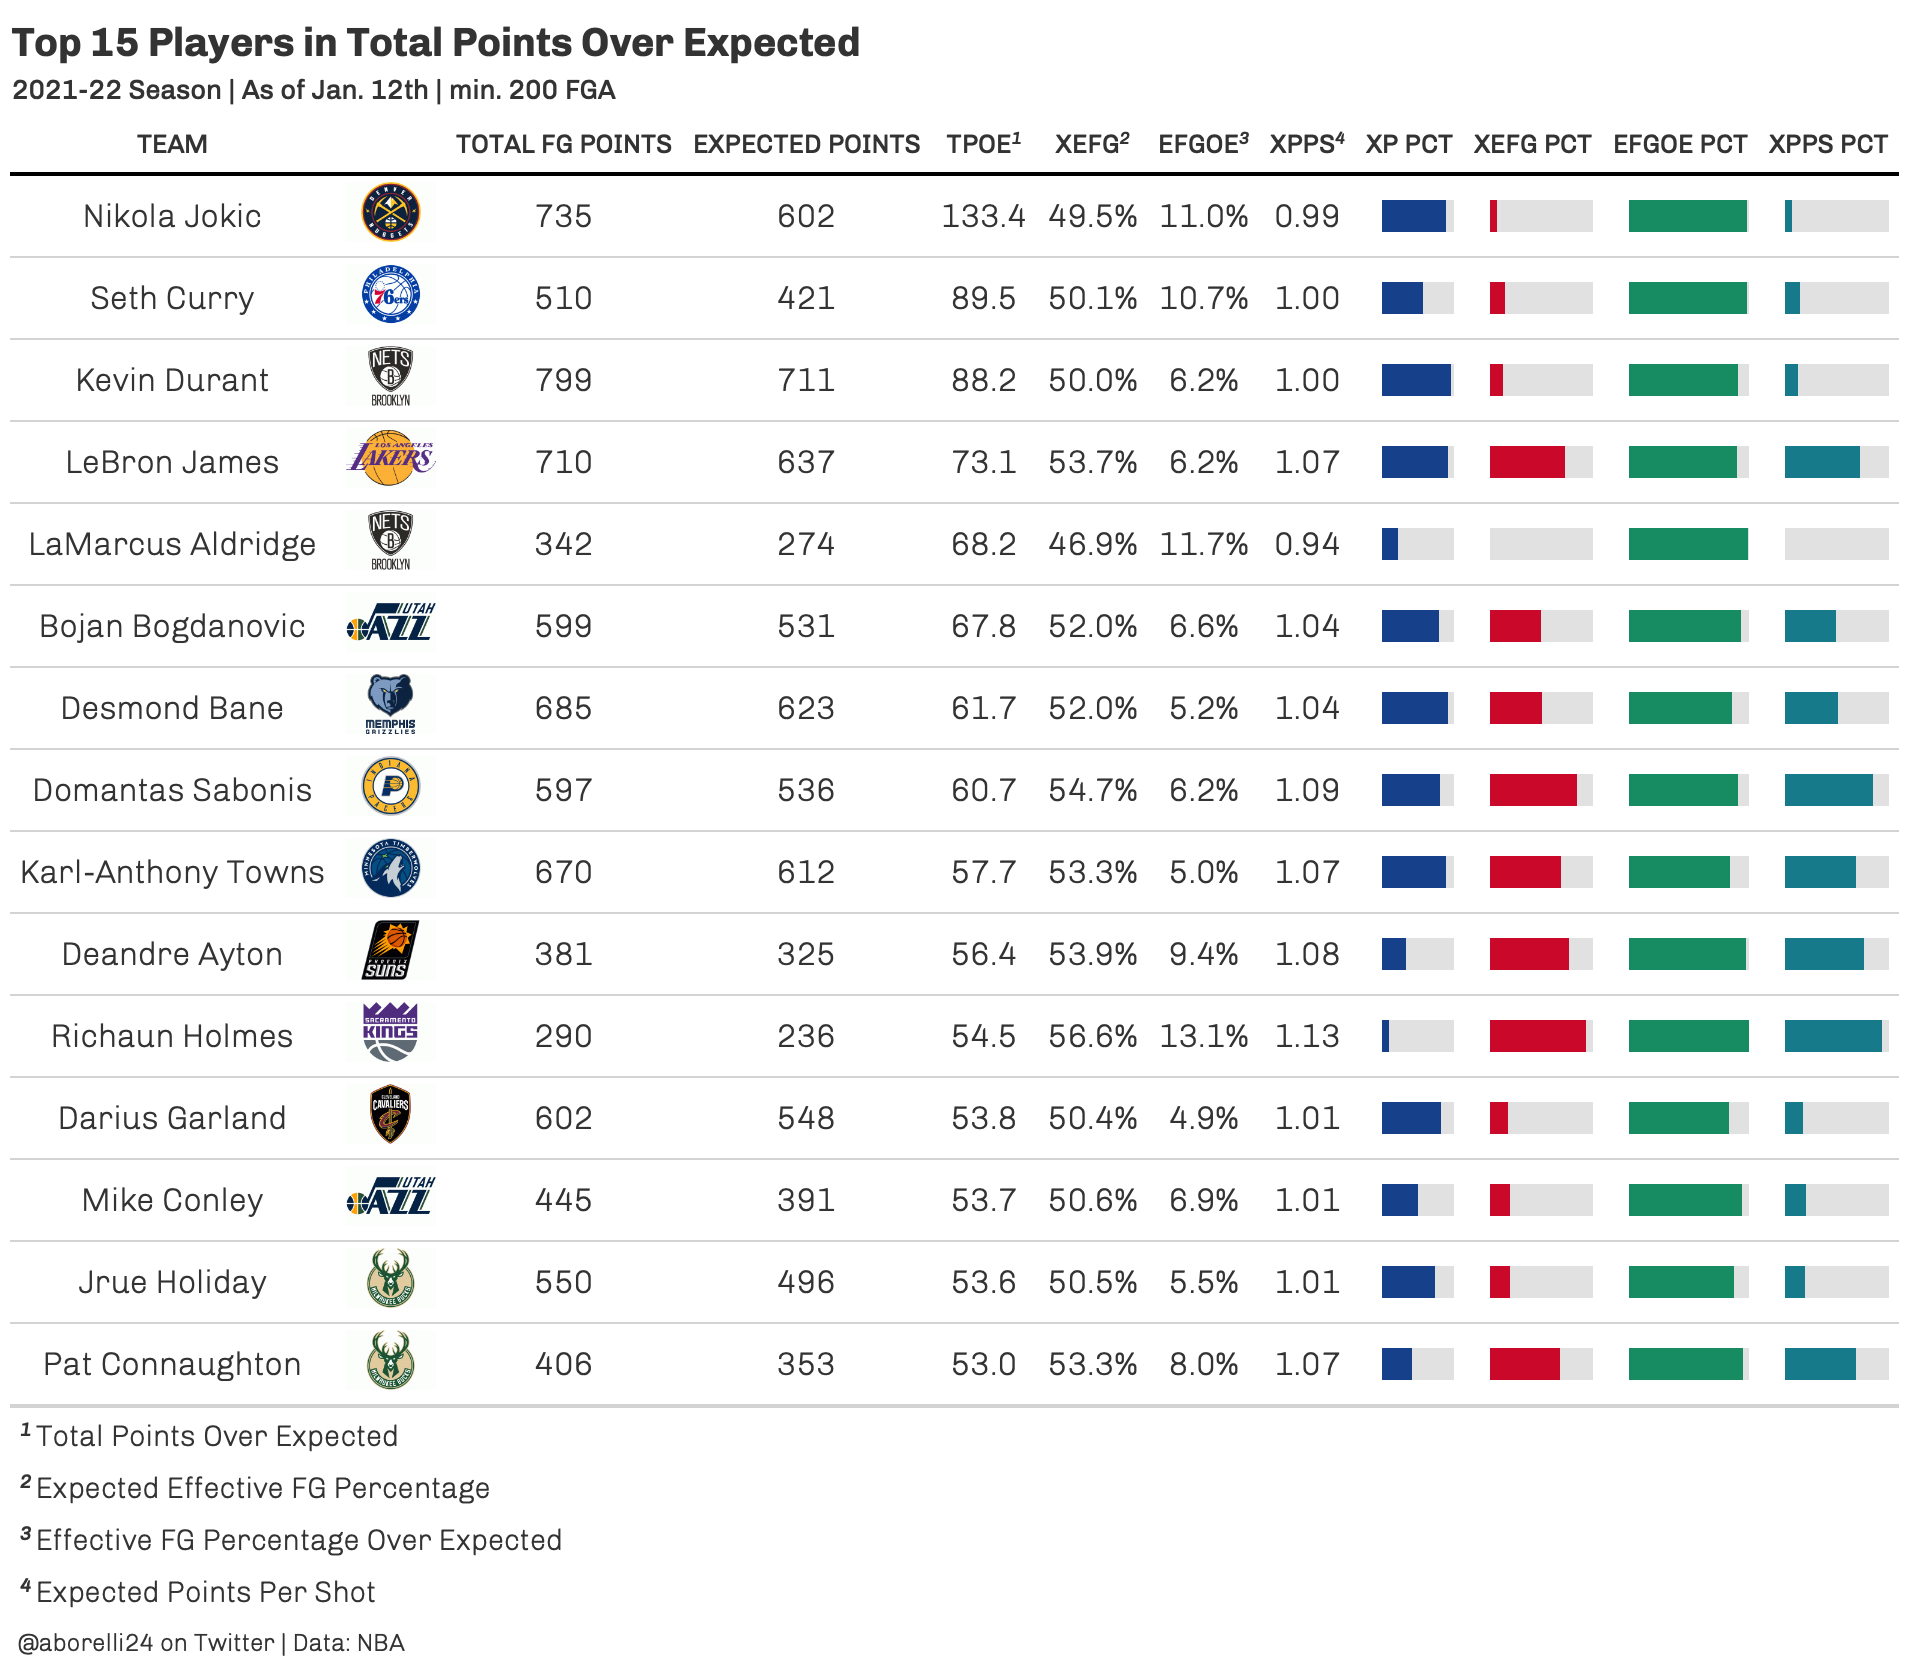
As for TPOE, we see that last year’s MVP winner scores more points than expected than anyone else. Seth Curry has made the most of his field goal opportunities, edging out Kevin Durant for 2nd place amongst players in TPOE.
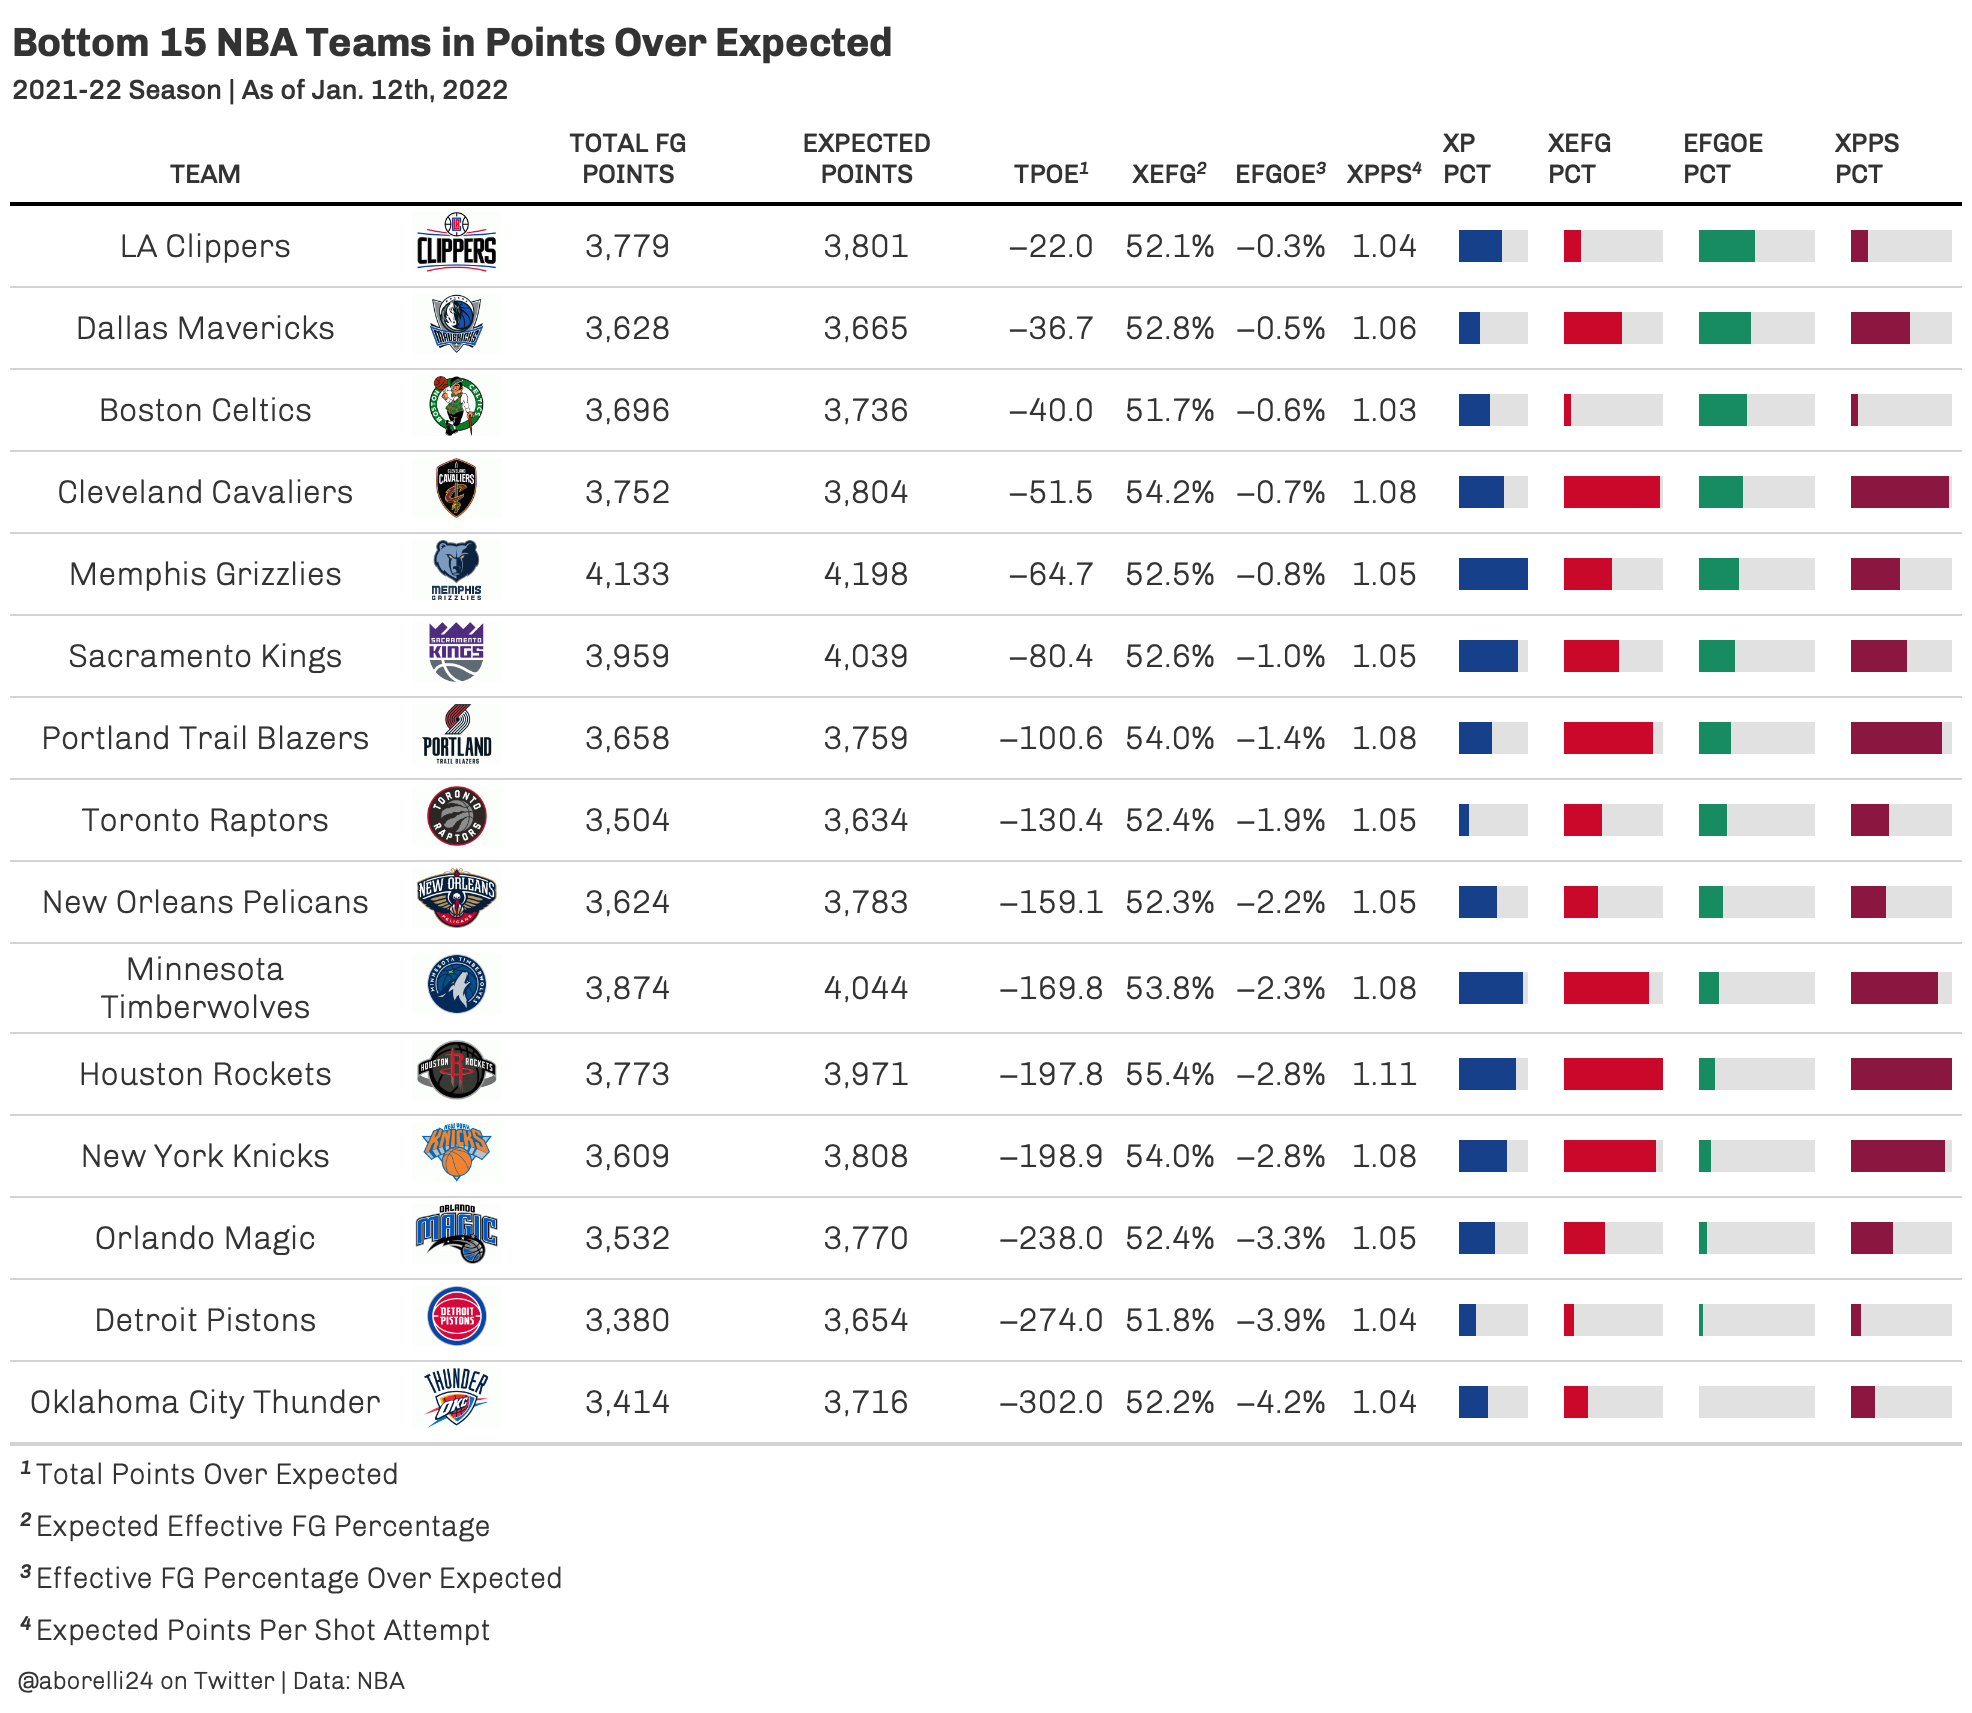
Now that we’ve looked at which players and teams have succeeded at scoring more points than expected, we can now pivot to those that don’t. The bottom couple of teams shouldn’t surprise you as the Thunder, Pistons, and Magic currently own the three worst records in the league.
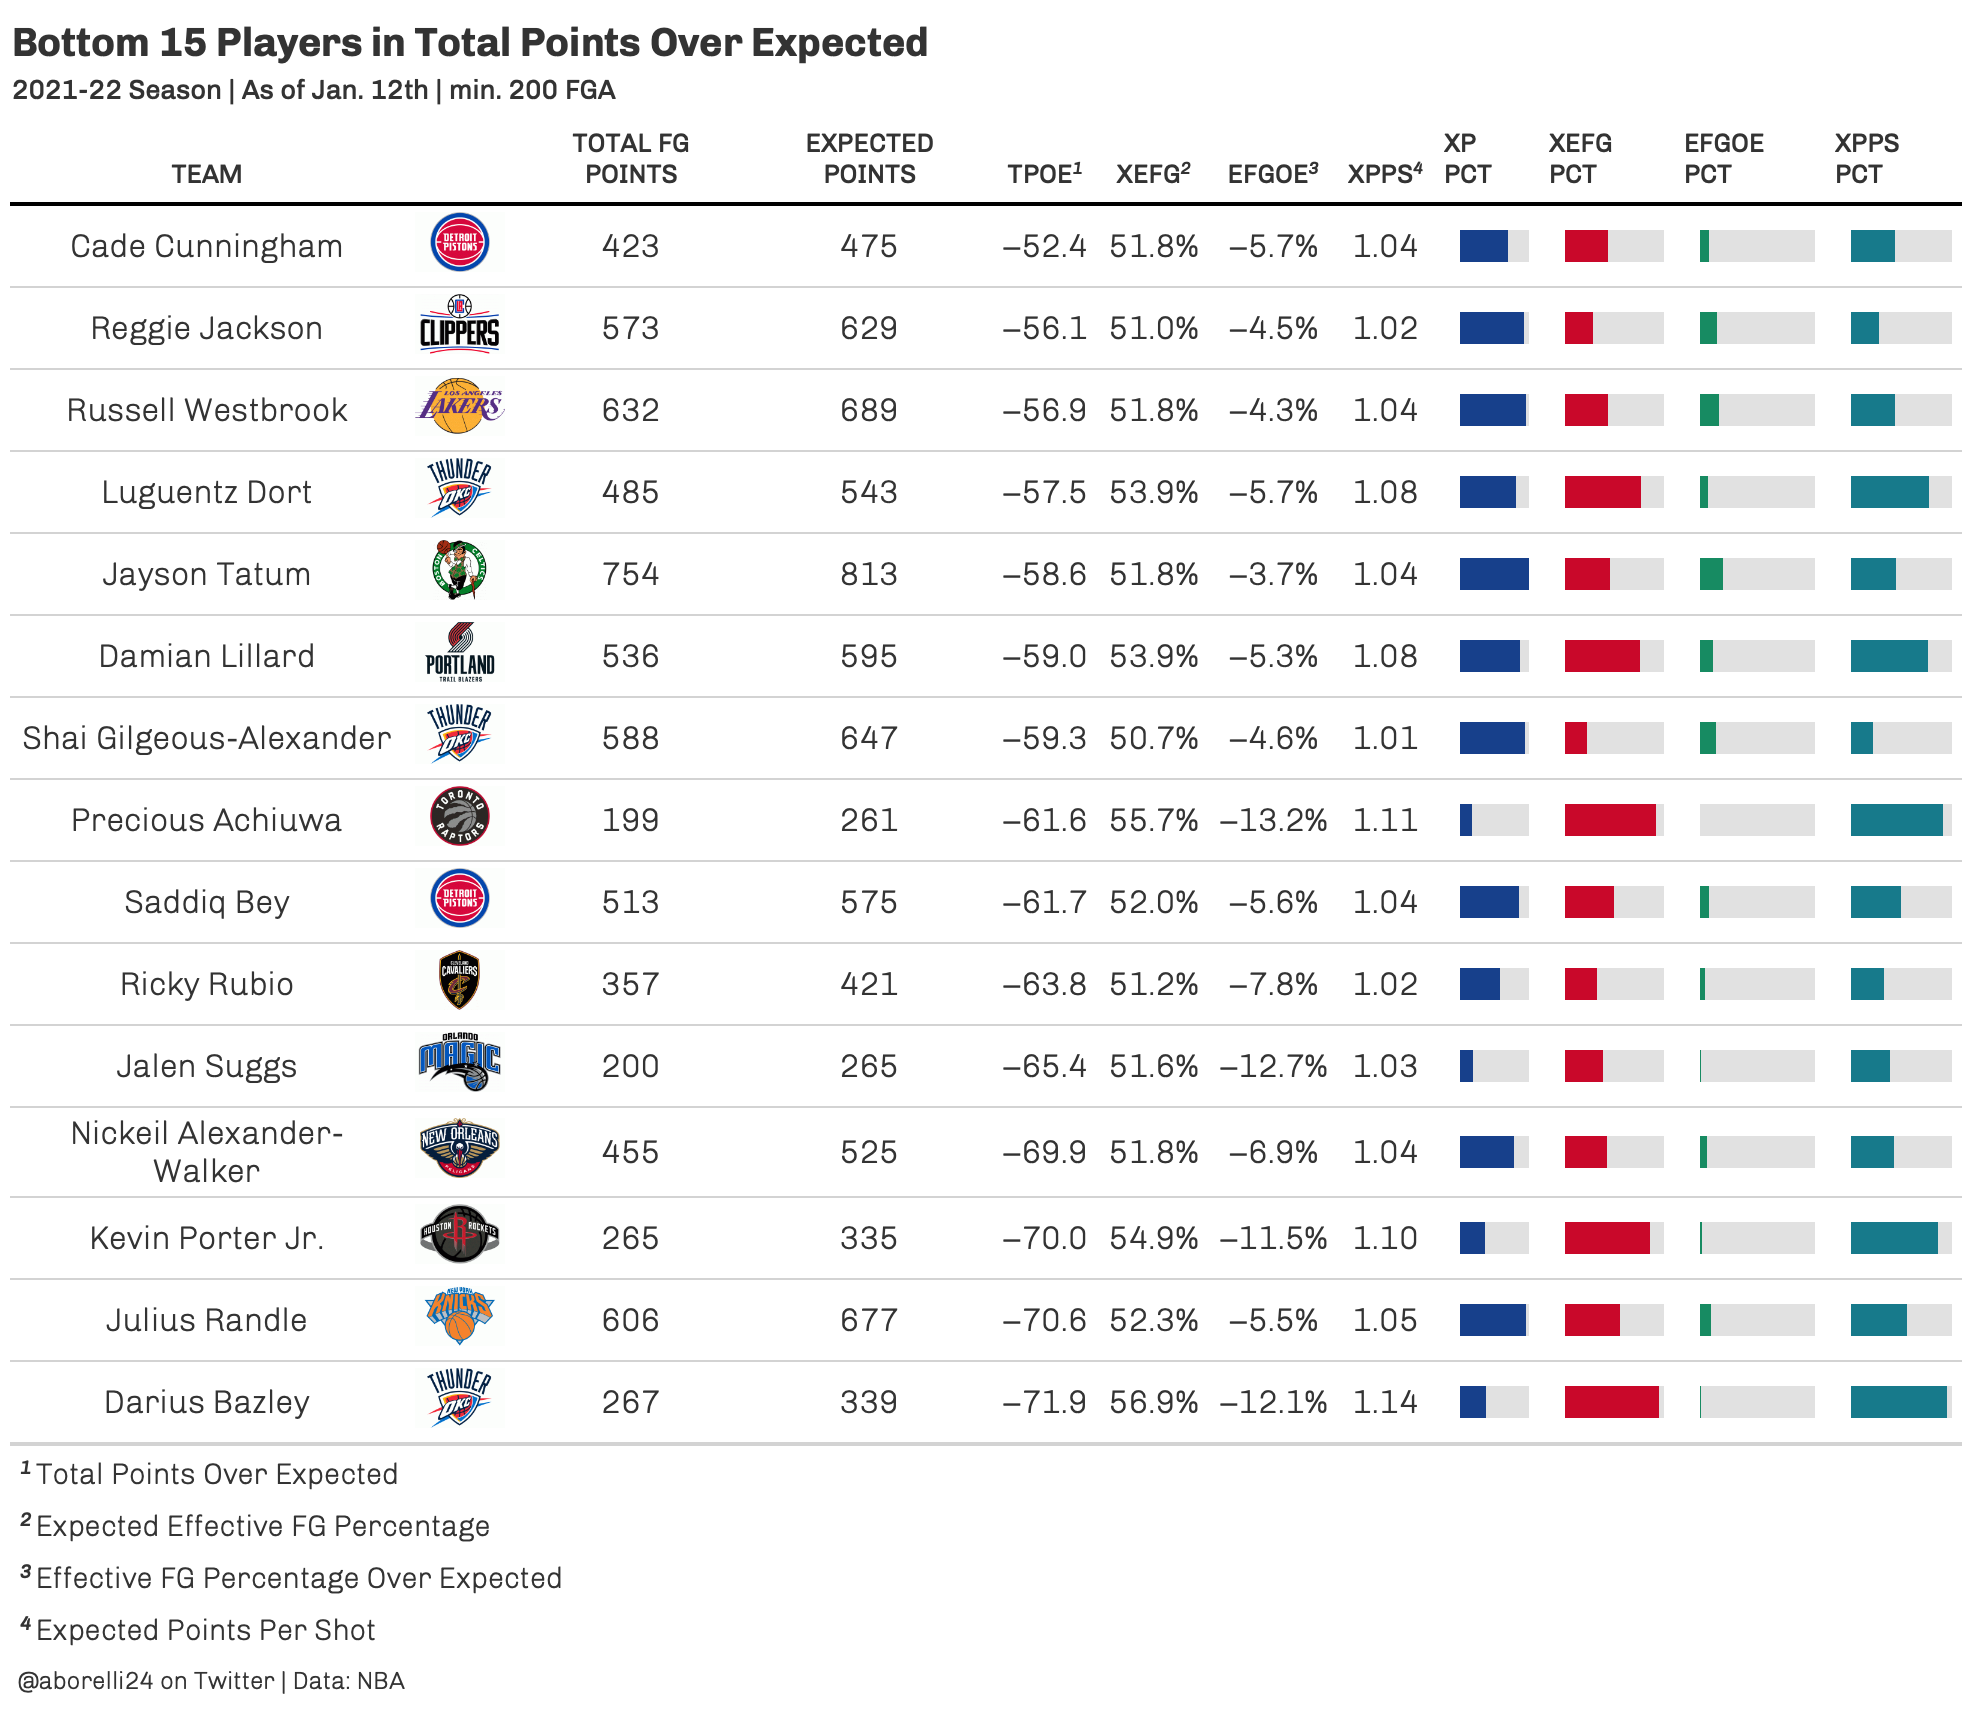
As for which players score the least amount of points than expected, Darius Bazley is TPOE’s biggest loser as he’s scored 71.9 fewer points than expected. Russell Westbrook, who has seemingly been a victim of the most blame for the Lakers’ struggles, finds himself 13th in TPOE - justifying Lakers fans’ concerns.
Devonte’ Graham’s Full Court Magic
Before concluding, I wanted to take a look at which shot ultimately had the lowest make probability amongst made shots this season. Devonte’ Graham’s full-court heave to beat the Thunder at the buzzer earlier this season was the answer to that question.
Graham’s shot, given its characteristics, had a make probability of 4.2%. Considering the 70-foot heave was a game-winning buzzer-beater and immediately followed Shai Gilgeous-Alexander’s 26-foot, 22.7% expected make probability shot to take the lead for the Thunder, this shot is by far the craziest of the season thus far. Check it out below:

Where My xP Metric Misses
My model gives us an interesting look at which players have over and underperformed this season. However, it isn’t perfect. It misses in a few areas, some of which are out of my control.
One of the main areas I wish I had access to was full NBA tracking data. Unfortunately due to the high privacy behind tracking data, my model doesn’t take into account distance from the nearest defender on shots. This ultimately doesn’t credit players like Kevin Durant who take more contested shots than anyone else.
I also wish I was able to include player usage metrics such as minutes played, days of rest, etc. My thought process behind that is that as players are used more in each game or throughout the season, fatigue may begin to take a toll on the player’s shooting success.
Conclusion
Evaluating players in the NBA is a combination of the eye test and analytics. Judging players off basic per-game stats isn’t always the best way of evaluating talent. Shots have context, the player success has context. My goal was to minimize the missing part of the story in shot success through expected points. Although not perfect, I believe it is a step towards understanding how players perform through expectedness.
Thank you
Follow me on Twitter or reach out if you have any questions - @aborelli24
Link to GitHub- https://github.com/afborell/NBA-xP-Project